

Information Disclosure Based on TCFD Recommendations
Our Group positions “Addressing Climate Change and Decarbonization” as one of our material priorities. We have long-term targets for reducing greenhouse gas emissions, and we are intensifying our efforts towards lowering our Group’s carbon footprint.
Based on the recommendations of the Task Force on Climate-related Financial Disclosures (TCFD), to which we pledged our support in October 2021, we are conducting scenario analysis for our business covering the risks and opportunities related to climate change. At the same time, we are enhancing information disclosure about our initiatives for decarbonization.
Governance
Important matters related to climate change, including climate-related risks and opportunities, are addressed by the Sustainability Committee, which was established for the purpose of formulating the Group's policies on sustainability and conducting activities related to those policies. The Sustainability Committee reports to the Board of Directors, which is responsible for overseeing the Committee, and which also regularly discusses matters related to climate change.
In addition, the rate of CO₂ emissions reduction is included as a “non-financial (ESG) assessment” in the performance evaluation index as a KPI for performance-linked executive compensation.
Promotion Structure
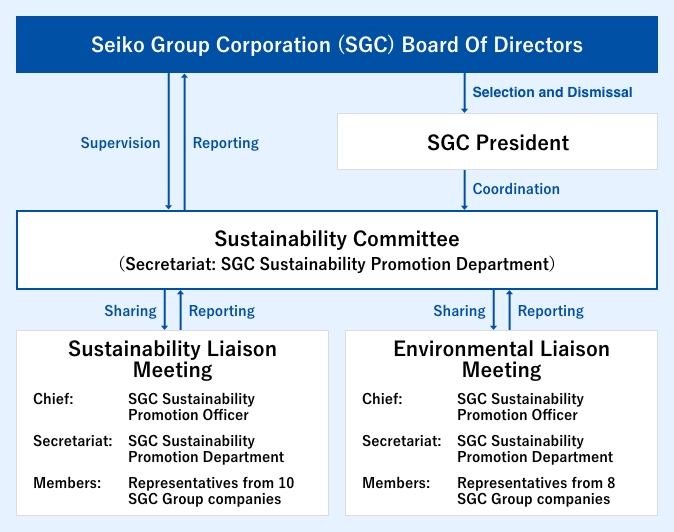
Roles
Board of Directors
The Board will receive reports on the Sustainability Committee’s resolutions at least once a year, and will oversee activities and progress on related issues. Additionally, it will hold regular discussions on matters of significance related to climate change.President(Climate Change Response Supervisor)
Important matters related to climate change are supervised by the President. The President serves as the chairman of the Sustainability Committee and is ultimately responsible for formulating the Group's sustainability-related policies, including matters related to climate change, and making decisions regarding all related activities.Sustainability Committee
The Committee is chaired by the President, who is in charge of climate change-related issues, as well as the presidents of all the Group companies. It also includes full-time officers, such as the Officer in Charge of Sustainability Promotion, who plays a key role in overseeing activities prescribed by the Sustainability Committee.Matters related to the Group's materiality, including those related to climate change, are addressed twice a year at regular meetings, and at extraordinary meetings when necessary, and the Committee’s decisions are reported to the Board of Directors.
Climate-related Board of Directors and Committee Meetings Held
As a general rule, material matters, including those related to climate change, are addressed by the Sustainability Committee twice a year, and their conclusions are reported to the Board of Directors at least once a year. The Seiko Group established the Sustainability Committee in September 2021, and since then, it has been actively discussing issues, making resolutions, and reporting those resolutions to the Board. The main climate-related matters decided are as follows:
| Month held | Main climate-related content + output | |
|---|---|---|
| Board of Directors | Nov. 2021 | Establishment of sustainability policy (Resolution) |
| Dec. 2021 | Establishment of long-term targets for reduction of greenhouse gas emissions (Report) | |
| Apr. 2022 | Key actions for materiality (Report) | |
| Jul. 2022 | Information disclosure based on TCFD recommendations (Report) | |
| Nov. 2022 | FY2021 Greenhouse Gas (GHG) Emissions (Report) | |
| Feb. 2023 | Information disclosure update based on TCFD recommendations (Report) | |
| Apr. 2023 | Plan to Introduce Renewable Energy is Ahead of Schedule (Report) | |
| Jul. 2023 | FY2022 GHG Emissions (Report) | |
| Nov. 2023 | Revision of Long-term Greenhouse Gas Emission Reduction Targets and Decarbonization Transition Plan (Report) | |
| Aug. 2024 | FY2023 GHG Emissions (Report) | |
| May. 2025 | Update Information Disclosure Based on TCFD Recommendations (Report) | |
| Sustainability Committee | Oct. 2021 | Key actions regarding materiality (Discussion) |
| Dec. 2021 | Establishment of long-term targets for reduction of greenhouse gas emissions (Discussion and Resolution) | |
| Mar. 2022 | Key actions regarding materiality (Discussion and Resolution) | |
| Jul. 2022 | Information disclosure update based on TCFD recommendations (Discussion and Resolution) | |
| Dec. 2022 | Decarbonization roadmap (including transition plan) (Discussion) | |
| Feb. 2023 | Information disclosure update based on TCFD recommendations (including decarbonization transition plan) (Discussion and Resolution) | |
| Mar. 2023 | Discussion and Resolution on the Accelerated Plan for the Introduction of Renewable Energy | |
| Jun. 2023 | FY2022 GHG Emissions (Report) | |
| Oct. 2023 | Discussion and Resolution on the Revision of Long-term Greenhouse Gas Emission Reduction Targets and Decarbonization Transition Plan | |
| Jul. 2024 | FY2023 GHG Emissions (Resolution) | |
| Nov. 2024 | How to Promote 100% Renewable Energy at Domestic Facilities in FY2024 (Report) | |
| May. 2025 | Update on Information Disclosure Based on TCFD Recommendations (Discussion and Resolution) |
Performance-Linked Executive Compensation
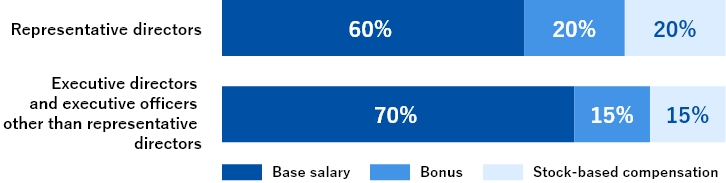
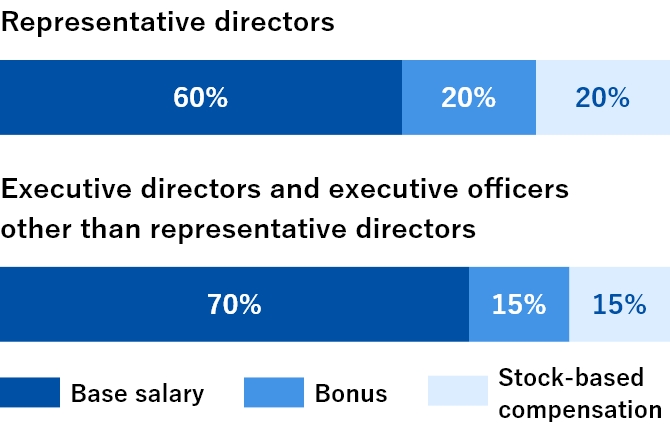
Executive director and executive officer compensation consists of fixed compensation (basic remuneration), stock-based remuneration, and performance-linked bonuses, while compensation for outside directors and other non-executive directors consists only of basic remuneration. Performance-linked compensation is based on both financial indicators, such as consolidated operating income, consolidated gross profit margin, and consolidated ROIC, and two non-financial indicators: individual evaluation and ESG evaluation (based on CO₂ emissions reductions, etc.). The compensation for each position is determined by the Board of Directors after deliberation by the Corporate Governance Committee to ensure that the level of compensation provides appropriate incentive.
The approximate amount for each type of compensation is as stated below. (This assumes a performance-based payment rate and qualitative evaluation of 100%)
Performance-linked Compensation Metrics
| Performance indicators | |
|---|---|
| Bonus | ①Consolidated operating profit |
| ②Consolidated net sales margin | |
| ③Individual performance evaluation | |
| Stock-based compensation | ①Consolidated operating profit |
| ②Consolidated net sales margin | |
| ③Consolidated ROIC | |
| ④ESG assessment: CO₂emissions reduction rate (SCOPE1,2), etc. |
Strategy
Scenario analysis process
We evaluate the financial and business impacts of climate-related risks and opportunities on the Group under different scenarios, and conduct scenario analysis with the aim of enhancing the Group’s resilience. The main scenario has been revised from a projection of less than 2℃ total global temperature rise to a scenario of a 1.5℃ rise.
Scope
This applies to all Group businesses and the entire value chain, including upstream and downstream, both in Japan and overseas
Reference Scenario
| Classification | Scenario Overview | Main Reference Scenario |
|---|---|---|
| 1.5℃ Scenario | A scenario in which multiple nations implement policies and regulations to achieve a decarbonized society, and the global temperature increase above pre-industrial levels is limited to 1.5℃. The transition risk is high, but the physical risk is lower than in the 4℃ scenario. | ・IEA World Energy Outlook 2024 Net Zero Emissions by 2050 Scenario ・IPCC SSP1-1.9 |
| 4℃ Scenario | A scenario in which no new policies and regulations are introduced, and global energy-derived CO₂ emissions continue to increase. Compared to the 1.5℃ scenario, the transition risk is low, but the physical risk is high. | ・IEA World Energy Outlook 2024 Stated Policy Scenario ・IPCC RCP8.5/SSP5-8.5 |
Scenario Analysis Steps
-
STEP 1 Identification of significant climate-related risks/
opportunities and establishment of parameters- Identify climate-related risks and opportunities
- Assess high significance risks/opportunities
- Set parameters related to highly significant risks/opportunities
-
STEP 2 Setting climate-related scenarios
- Based on the information in STEP 1, etc., identify scenarios that are closely related to the existing scenarios
- Establish climate-related scenarios (social vision)
-
STEP 3 Assessment of financial
impact for each scenario- Analyze the financial impact of each scenario based on the scenarios established in STEP 2 and the key climate-related risks/opportunities and related parameters identified in STEP 1
-
STEP 4 Assessment of the resilience of the strategy to climate-related risks and opportunities and further measures to address them
- Assess the resilience of our strategy to climate-related risks and opportunities
- Consider further response measures
Business impact associated with climate-related risks and opportunities and the Group's response
We have conducted scenario analysis covering all Group businesses, and assessed key risks and opportunities. Based on this review, we are formulating and implementing measures to address these risks.
Climate-related risk
| Risk category | Risk description | Business impact (2030)*1 | Our Group's response | |||
|---|---|---|---|---|---|---|
| 1.5℃ Scenario | 4℃ Scenario | |||||
| Risk | Transition risk | Policy & regulation | Increased costs due to introduction and strengthening of carbon tax | 850 million yen*2 Medium |
480 million yen*2 Medium |
|
| Market | Decreased sales due to inability to respond to requests from suppliers for climate-related measures | Medium | Medium |
|
||
| Increased procurement costs due to higher raw material prices | Small | Small |
|
|||
| Physical risk | Urgent | Decline in sales due to supply chain disruptions and logistics delays due to abnormal weather | Small | Medium |
|
|
| Decline in sales due to interruption of plant and store operations due to abnormal weather and difficulties in securing personnel | Medium | Large | ||||
| Chronic | Rising loss premiums due to increase in extreme weather conditions | Medium | Medium | |||
Climate-related opportunities
| Opportunity category | Opportunity description | Business impact (2030) *1 | Our Group's response | ||
|---|---|---|---|---|---|
| 1.5℃ scenario | 4℃ scenario | ||||
| Opportunity | Energy source | Cost reduction by introducing renewable energy | Small | Small |
|
| Products and services | Increased sales of low-power- consumption compatible products due to expansion of CPS/IoT society | Medium | Medium |
|
|
| Increased sales of related parts to automobile sector due to ongoing shift to EVs | Medium | Medium |
|
||
| Increased sales of low-carbon products and services that can help customers reduce their environmental impact | Large | Medium |
|
||
| Increased sales of products that respond to consumers' growing environmental awareness | Small | Small |
|
||
| Market | Increased sales due to improved brand value through decarbonized management | Medium | Small |
|
|
- Large business impact: Extremely significant impact on business, such as an impact on profits of ¥1 billion or more, withdrawal from a business, or an interruption of business for several months or more.
Medium business impact: Significant impact on business, such as a profit impact of between 100 million yen and ¥1 billion, negative impact on business plans, downsizing of a business, or a business interruption of one week to one month.
Small business impact: Minor or negligible impact on business, such as a profit impact of less than 100 million yen, little or no impact on business plans, or little or no interruption of business. - GHG emissions for 2030 (Scope 1 and 2) are calculated based on current growth projections and GHG reduction plans, and are multiplied by the IEA carbon price for both the 1.5℃ and 4℃ scenarios. (Exchange rate 1$=145JPY)
Resilience Assessment
By doing this scenario analysis, we were able to foresee the Group's resilience during the transition to a decarbonized society.
We will continue to promote strenuous efforts to cope with and ameliorate climate change.
We will also keep promoting strategic initiatives to further enhance our resilience to the impact of the business transition that we must carry out.
Risk Management
In order to centrally manage risks that could have a significant impact on the Group's business, the Seiko Group Risk Management Committee, chaired by the President of the Seiko Group, plays a central role in developing and strengthening Group-wide risk management. In addition, in order to promote risk management through close cooperation between Seiko Group Corporation (SGC) and its various Group companies, SGC established a Group Risk Management Committee comprised of the presidents of each Group company, and also established a system to identify and share information about risks that could affect the Group.
In order to conduct a more detailed analysis of climate-related risks, the Sustainability Committee uses scenario analysis to identify and evaluate high-impact climate-related risks at Group companies. It also makes resolutions and suggests countermeasures, which it promotes through cooperation with the Group companies. The content of resolutions is reported to the Board of Directors and the Company's Risk Management Committee.
Group Risk Management Promotion Structure
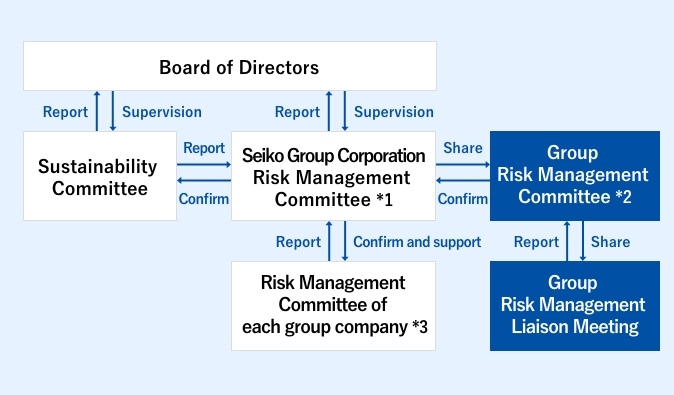
Roles
Seiko Group Risk Management Committee *1
Chaired by the President, the Seiko Group Risk Management Committee focuses on risks that need to be addressed across the Group. The Committee also receives reports from risk owners at the Company and at Group companies, and supports the promotion of risk management at each company.Group Risk Management Committee *2
This Committee, which is comprised of full-time officers and presidents of Group companies, identifies risks across the entire Group, monitors responses to the most important risks, and shares relevant information with Group firms.Risk Management Committee of Each Group Company *3
Each Group company promotes risk management autonomously, led by its own Risk Management Committee.Sustainability Committee
The Seiko Group discusses and determines policy on matters related to the Group's materiality, including climate-related risks, and reports the details to the Board of Directors and the Seiko Group Risk Management Committee.
Metrics and Targets
In November 2023, the Group revised its long-term target and has been strategically reducing GHG emissions from its domestic bases. In line with our long-term goals, we will continue to accelerate the introduction of renewable energy at our overseas bases and strive to further reduce GHG emissions.
Our FY2030 target has been certified as consistent with the 1.5℃ level set by the Paris Agreement. The SBT certification was presented by the Science Based Targets initiative (SBTi).
Long-Term Targets for Greenhouse Gas Emissions Reduction
Greenhouse gas emissions reduction target
Fiscal Year 2030
Scope1, 242% reduction compared to the FY2022 level.
Scope325% reduction compared to the FY2022 level, targeting categories 1 and 11.
Fiscal year 2050
Aiming for net zero.
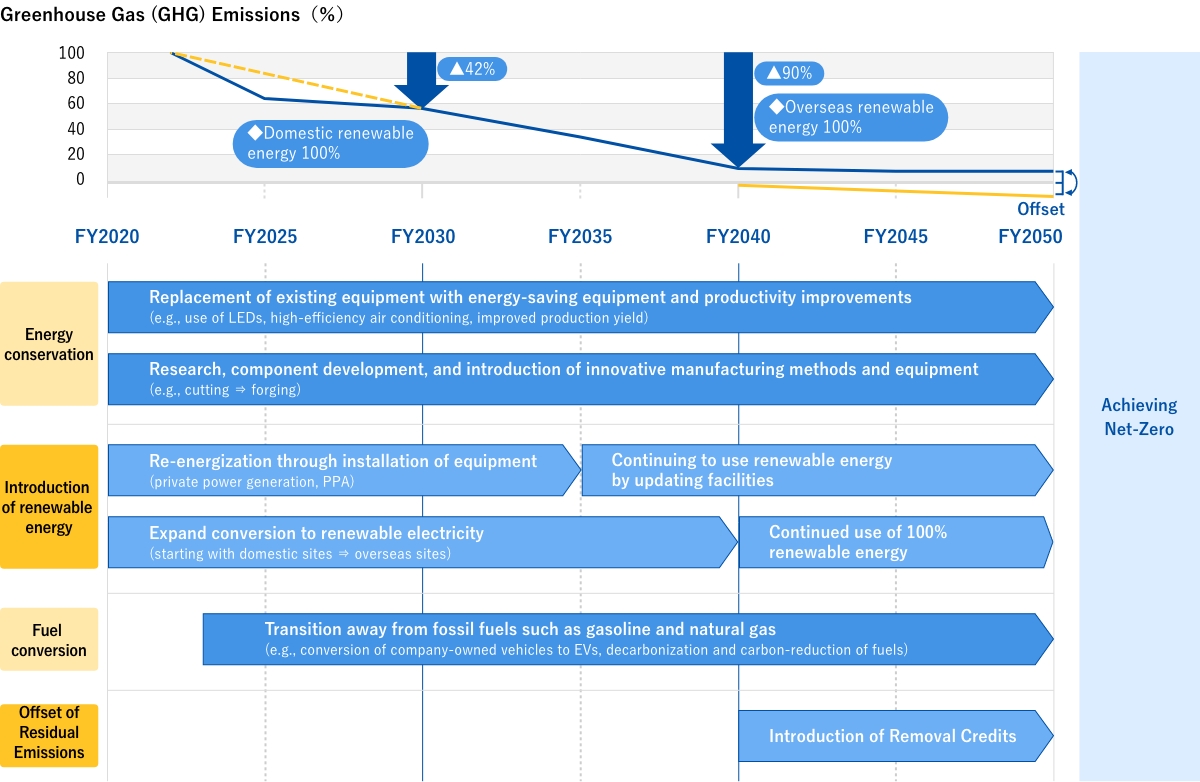
Decarbonization Transition Plan (Scope 1, 2)
In November 2023, the Seiko Group revised its decarbonization roadmap to align it with our updated long-term targets for reducing greenhouse gas emissions. The Group continues to make progress in energy efficiency by updating existing facilities with energy-efficient equipment, enhancing productivity, and by investigating, developing, and implementing energy-efficient manufacturing methods and devices.
As a result, we finished converting all of our domestic bases to renewable energy during FY2024. We plan to achieve 100% renewable energy at all our overseas bases as well by the end of fiscal 2040. The Group aims to switch from fossil fuels to decarbonized or low-carbon alternative fuels. The residual emissions will be offset through the introduction of removal credits, with the aim of achieving net-zero emissions by fiscal year 2050.
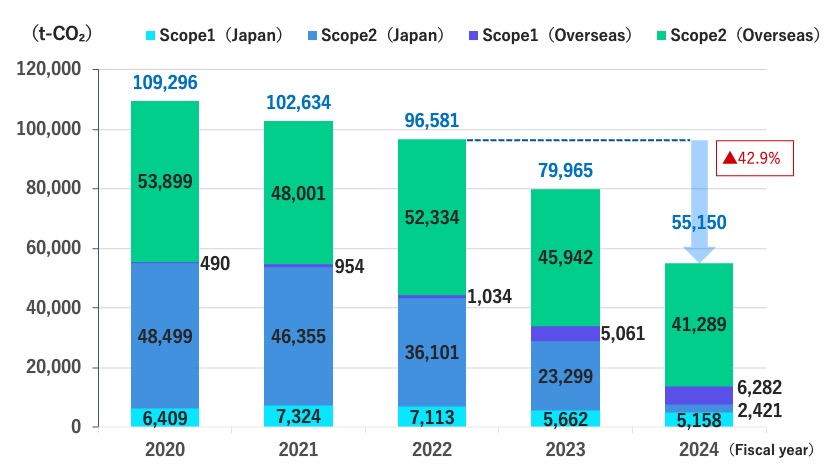
Scope 1 and 2 Greenhouse Gas (GHG) Emissions FY2020~FY2024
In fiscal year 2024, our greenhouse gas emissions (Scope 1 and 2) totaled 55,150 t-CO₂, marking a 42.9% reduction compared to fiscal 2022. This result significantly exceeded the 10.5% reduction required to achieve our long-term targets. This impressive reduction was achieved through energy-saving initiatives at each site, as well as the transition to virtually 100% renewable electricity use across all domestic locations. Furthermore, the ratio of renewable energy in the Group’s total electricity consumption climbed to 49.2%.
- Scope1: Direct emissions by the reporting company (e.g., fuel combustion)
- Scope2: Indirect emissions from the generation of purchased electricity and other energy
- ■Scope of Data Aggregation:
These two Scopes include Seiko Group Corporation and all its Group companies, both domestic and international, including tenants, retail stores, warehouses, and other facilities. - ●Scope1: Includes greenhouse gas emissions other than CO₂. There are no emissions classified as biogenic.
- ・For both Japan and overseas, emissions from fuel are calculated using the calorific values and emission factors of each fuel, and those of non-CO₂ greenhouse gases are calculated using the global warming potential (GWP) of each gas type.
Those values and factors are listed in the “Calculation, Reporting, and Publication System” under Japan’s Act on Promotion of Global Warming Countermeasures. - ・Scope 1 includes fuel usage by company vehicles, but does not include energy usage by subcontractors.
- ●Scope2: Market-based approach
- ・For electricity related emissions: For operations in Japan, adjusted emission factors are applied in accordance with the aforementioned Act on Promotion of Global Warming Countermeasures, using the published factors for each electric utility.
- ・For operations outside Japan, where utility-specific emission factors are not available, country-level factors published by the International Energy Agency (IEA) are applied.
- ・For locations such as retail outlets or warehouses where electricity usage cannot be directly identified, consumption is estimated based on floor area and emission intensity per unit of area.
- ・The impact of renewable energy certificates and other environmental value instruments is also reflected in the calculations.
- ●For overseas sites prior to FY2022, only energy-related CO₂ emissions are included.
- ●Scope 1 and Scope 2 data from FY2022 onward have undergone third-party verification by an external verification body.
As a result, previously published figures may be revised.
Note: Due to rounding, totals may not match the sum of individual components.
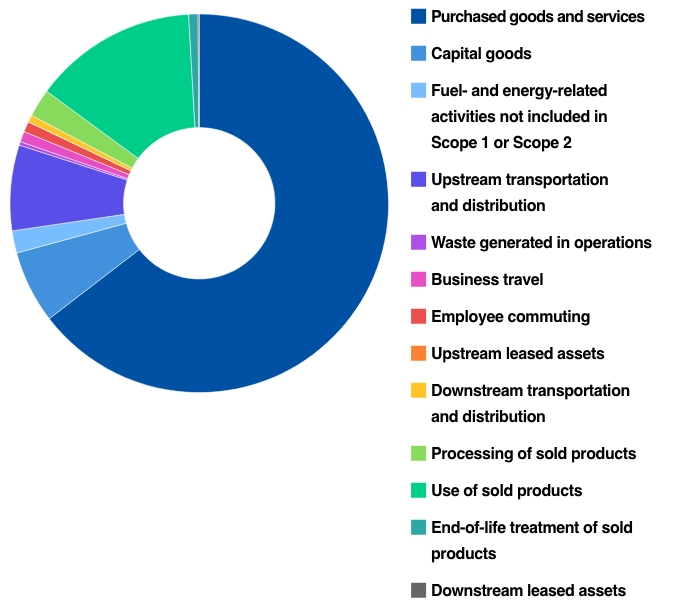
Scope 3 Greenhouse Gas (GHG) Emissions
In fiscal year 2024, Scope 3 greenhouse gas emissions totaled 572,503 t-CO₂.
By category, the largest contributors were Category 1: Purchased goods and services, which accounted for approximately 65%, and Category 11: Use of sold products, which represented around 14%.
Emissions in fiscal year 2024
| Category | Item | GHG emissions (t-CO₂) |
% |
|---|---|---|---|
| Category 1 | Purchased goods and services | 369,346 | 64.5% |
| Category 2 | Capital goods | 35,373 | 6.2% |
| Category 3 | Fuel- and energy-related activities not included in Scope 1 or Scope 2 | 11,074 | 1.9% |
| Category 4 | Upstream transportation and distribution | 41,938 | 7.3% |
| Category 5 | Waste generated in operations | 1,676 | 0.3% |
| Category 6 | Business travel | 5,188 | 0.9% |
| Category 7 | Employee commuting | 5,048 | 0.9% |
| Category 8 | Upstream leased assets | 123 | 0.0% |
| Category 9 | Downstream transportation and distribution | 3,692 | 0.6% |
| Category 10 | Processing of sold products | 13,777 | 2.4% |
| Category 11 | Use of sold products | 79,961 | 14.0% |
| Category 12 | End-of-life treatment of sold products | 4,826 | 0.8% |
| Category 13 | Downstream leased assets | 482 | 0.1% |
| Category 14 | Franchises | - | - |
| Category 15 | Investments | - | - |
| total | 572,503 | 100.0% | |
- ■Scope of Data Aggregation
The scope includes Seiko Group Corporation and all domestic and international Group companies. (Note: In FY2020, only selected Group companies were included.) - ●Emission factors
For both domestic and international operations, emission factors are based on the Emission Factor Database (Ver. 3.5) and the LCI Database IDEA (Ver. 2.3), used for calculating greenhouse gas emissions through the supply chain. - ●Third-party verification
Scope 3 data (Categories 1, 4, and 11) from FY2022 onward have undergone third-party verification by an external verification body. As a result, previously published figures may be subject to revision.
●Rounding
Due to rounding, total values may not match the sum of individual components.
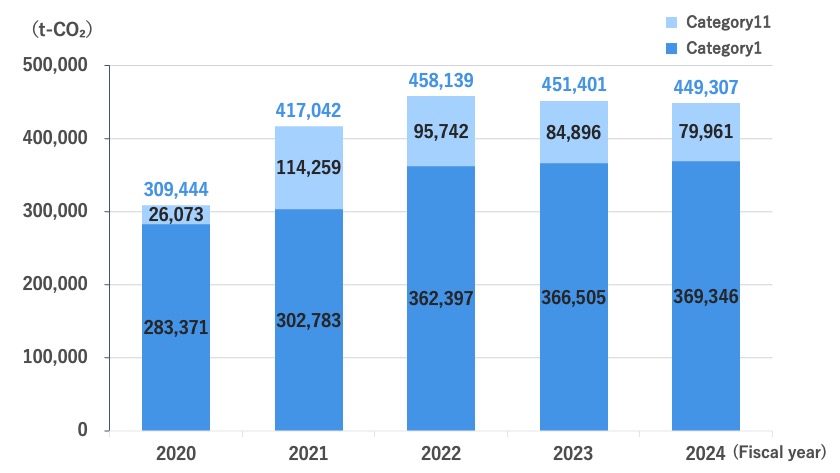
Emissions from Categories 1 and 11
For Categories 1 and 11, which are included in the Company’s emission reduction targets, emissions from Category 1 (Purchased goods and services) increased in line with higher sales. However, this was more than offset by a decline in Category 11 (Use of sold products), due to an increase in the sales ratio of energy-efficient products. As a result, total emissions showed a slight reduction compared with the FY2022 baseline we are using for our FY2030 reduction target.
●Rounding
Due to rounding, total values may not match the sum of individual components.