
Environmental Data
- Note: Due to numerical rounding, the total may not match.
-
- Seiko Group:
- Total of 249 locations
(12 domestic manufacturing sites, 157 domestic non-manufacturing sites, 9 overseas manufacturing sites, 71 overseas non-manufacturing sites)
Energy consumption
Energy Consumption (Worldwide)
Scope of Data Reviewed: Seiko Group
(Unit: MWh)
| FY2019 | FY2020 | FY2021 | FY2022 | FY2023 | |
|---|---|---|---|---|---|
| Japan | 133,497 | 131,314 | 134,448 | 132,309 | 109,481 |
| Overseas | 113,914 | 110,006 | 118,847 | 116,203 | 106,831 |
| Total | 247,410 | 241,320 | 253,295 | 248,512 | 216,313 |
Electricity Consumption
Scope of Data Reviewed: Seiko Group
(Unit: MWh)
| FY2019 | FY2020 | FY2021 | FY2022 | FY2023 | |||
|---|---|---|---|---|---|---|---|
| Japan | Non-renewable energy | 104,403 | 102,046 | 102,894 | 77,553 | 55,784 | |
| Renewable energy | 0 | 0 | 1,413 | 25,897 | 27,926 | ||
| Breakdown: | Purchased | 0 | 0 | 1,413 | 25,897 | 25,506 | |
| Generated | 0 | 0 | 0 | 0 | 0 | ||
| Certificates | 0 | 0 | 0 | 0 | 2,420 | ||
| Total for Japan | 104,403 | 102,046 | 104,307 | 103,450 | 83,710 | ||
| Renewable Energy Ratio | 0% | 0% | 1.4% | 25.0% | 33.4% | ||
| FY2019 | FY2020 | FY2021 | FY2022 | FY2023 | |||
| Overseas | Non-renewable energy | 111,111 | 107,375 | 98,176 | 102,843 | 90,479 | |
| Renewable energy | 0 | 0 | 14,535 | 6,727 | 6,101 | ||
| Breakdown: | Purchased | 0 | 0 | 0 | 174 | 401 | |
| Generated | 0 | 0 | 1,535 | 3,453 | 5,700 | ||
| Certificates | 0 | 0 | 13,000 | 3,100 | 0 | ||
| Total for Overseas | 111,111 | 107,375 | 112,711 | 109,570 | 96,580 | ||
| Renewable Energy Ratio | 0% | 0% | 12.9% | 6.1% | 6.3% | ||
| FY2019 | FY2020 | FY2021 | FY2022 | FY2023 | |||
| Japan + Overseas |
Non-renewable energy | 215,515 | 209,422 | 201,070 | 180,395 | 146,263 | |
| Renewable energy | 0 | 0 | 15,948 | 32,624 | 34,027 | ||
| Breakdown: | Purchased | 0 | 0 | 1,413 | 26,071 | 25,907 | |
| Generated | 0 | 0 | 1,535 | 3,453 | 5,700 | ||
| Certificates | 0 | 0 | 13,000 | 3,100 | 2,420 | ||
| Total for Japan+Overseas | 215,515 | 209,422 | 217,018 | 213,020 | 180,290 | ||
| Renewable Energy Ratio | 0% | 0% | 7.3% | 15.3% | 18.9% | ||
Greenhouse Gas (GHG) Emissions
Scope 1 (Direct Emissions from Owned or Controlled Sources)
Scope of Data Reviewed: Seiko Group
(Unit: t-CO₂)
| FY2019 | FY2020 | FY2021 | FY2022 | FY2023 | |
|---|---|---|---|---|---|
| Japan | 6,313 | 6,409 | 7,324 | 7,113 | 5,662 |
| Overseas | 521 | 490 | 954 | 1,034 | 5,061 |
| Total | 6,834 | 6,898 | 8,279 | 8,147 | 10,723 |
- ■Notes:
- ・Includes greenhouse gases other than CO₂
・Excludes biogenic GHG emissions - ■Emission Factors:
- ・Fuel: Uses the "Calculation Methods and Emission Factors List" from the Act on Promotion of Global Warming Countermeasures
・Greenhouse gases other than CO₂:Uses the "Calculation Methods and Emission Factors List" from the Act on Promotion of Global Warming Countermeasures
Scope2(Indirect emissions associated with the use of energy such as electricity and heat.)
Scope of Data Reviewed: Seiko Group
(Unit: t-CO₂)
| FY2019 | FY2020 | FY2021 | FY2022 | FY2023 | |
|---|---|---|---|---|---|
| Japan | 50,829 | 48,499 | 46,355 | 36,101 | 23,299 |
| Overseas | 55,944 | 53,899 | 48,001 | 52,334 | 45,942 |
| Total | 106,773 | 102,398 | 94,356 | 88,434 | 69,242 |
- ■Notes:
- ・Calculated based on market standards
- ■Emission Factors:
-
- ・Electricity:
- Japan: Uses the "Emission Factors by Electric Power Company" standards from the Act on Promotion of Global Warming Countermeasures
Overseas: Uses the emission factors of each country from the International Energy Agency (IEA)
Scope1+2
Scope of Data Reviewed: Seiko Group
(Unit: t-CO₂)
| FY2019 | FY2020 | FY2021 | FY2022 | FY2023 | |
|---|---|---|---|---|---|
| Japan | 57,142 | 54,908 | 53,679 | 43,214 | 28,962 |
| Overseas | 56,465 | 54,388 | 48,955 | 53,368 | 51,003 |
| Total | 113,607 | 109,296 | 102,634 | 96,581 | 79,965 |
Scope3
Scope of Data Reviewed: Seiko Group
| Category | Items | GHG Emissions (t-CO₂) |
% |
|---|---|---|---|
| Category 1 | Purchased goods and services | 366,505 | 64.4% |
| Category 2 | Capital goods | 36,082 | 6.3% |
| Category 3 | Fuel- and energy-related activities not included in Scope 1 or Scope 2 | 12,399 | 2.2% |
| Category 4 | Upstream transportation and distribution | 35,093 | 6.2% |
| Category 5 | Waste generated in operations | 2,464 | 0.4% |
| Category 6 | Business travel | 4,506 | 0.8% |
| Category 7 | Employee commuting | 5,380 | 0.9% |
| Category 8 | Upstream leased assets | 122 | 0.0% |
| Category 9 | Downstream transportation and distribution | 3,476 | 0.6% |
| Category 10 | Processing of sold products | 12,469 | 2.2% |
| Category 11 | Use of sold products | 84,896 | 14.9% |
| Category 12 | End-of-life treatment of sold products | 4,573 | 0.8% |
| Category 13 | Downstream leased assets | 708 | 0.1% |
| Category 14 | Franchises | - | - |
| Category 15 | Investments | - | - |
| Total | 568,674 | 100.0% |
NOx、SOx
Scope of Data Reviewed: (NOx): Three domestic manufacturing sites required to take measurements under the Air Pollution Control Law in Japan
Scope of Data Reviewed: (SOx): Three domestic manufacturing sites required to take measurements under the Air Pollution Control Law in Japan
(Unit: t)
| FY2019 | FY2020 | FY2021 | FY2022 | FY2023 | |
|---|---|---|---|---|---|
| NOx emissions | 1.3 | 1.5 | 5.1 | 4.3 | 4.5 |
| SOx emissions | 0.04 | 0.04 | 0.3 | 0.3 | 0.4 |
※Scope of Data Reviewed: Before Fiscal Year 2020 NOx: 3 domestic locations targeted, SOx: 2 domestic locations targeted
Waste
Waste Output
Scope of Data Reviewed: A total of 23 companies, including manufacturing bases and offices, both in Japan and overseas
(Unit: t)
| FY2019 | FY2020 | FY2021 | FY2022 | FY2023 | |
|---|---|---|---|---|---|
| Japan | 2,217 | 2,126 | 2,177 | 2,255 | 2,133 |
| Overseas | 2,907 | 3,107 | 3,510 | 3,409 | 2,854 |
| Total | 5,124 | 5,232 | 5,686 | 5,664 | 4,987 |
Recycling Rate
Scope of Data Reviewed: A total of 23 companies, including manufacturing bases and offices, both in Japan and overseas
(Unit: %)
| FY2019 | FY2020 | FY2021 | FY2022 | FY2023 | |
|---|---|---|---|---|---|
| Japan | 80% | 76% | 76% | 72% | 73% |
| Overseas | 68% | 65% | 71% | 69% | 66% |
| Total | 73% | 69% | 73% | 70% | 69% |
Recycling rate includes heat recovery
Paper Usage
Paper Usage
Scope of Data Reviewed: A total of 28 companies, including manufacturing bases and offices, both in Japan and overseas
(Unit: t)
| FY2019 | FY2020 | FY2021 | FY2022 | FY2023 | |
|---|---|---|---|---|---|
| Japan | 60 | 45 | 42 | 42 | 46 |
| Overseas | 21 | 19 | 18 | 17 | 14 |
| Total | 81 | 64 | 60 | 58 | 60 |
Water
Water Withdrawal Volume
Scope of Data Reviewed: Seiko Group
(Unit: thousand m³)
| FY2019 | FY2020 | FY2021 | FY2022 | FY2023 | ||
|---|---|---|---|---|---|---|
| Japan | Surface water | 176 | 166 | 166 | 159 | 158 |
| Industrial water | 23 | 17 | 12 | 10 | 18 | |
| Groundwater | 256 | 256 | 264 | 242 | 216 | |
| Japan Total | 455 | 438 | 442 | 412 | 392 | |
| Overseas | Surface water | 416 | 376 | 349 | 349 | 348 |
| Industrial water | 0 | 0 | 0 | 0 | 0 | |
| Groundwater | 0 | 0 | 0 | 0 | 0 | |
| Overseas Total | 416 | 376 | 349 | 349 | 348 | |
| Japan+Overseas | Combined Total | 870 | 814 | 791 | 761 | 740 |
Water Discharge Volume
Scope of Data Reviewed: Seiko Group
(Unit: thousand m³)
| FY2019 | FY2020 | FY2021 | FY2022 | FY2023 | ||
|---|---|---|---|---|---|---|
| Japan | Rivers | 235 | 230 | 249 | 235 | 176 |
| Sewers | 33 | 31 | 31 | 48 | 45 | |
| Japan Total | 269 | 262 | 280 | 283 | 221 | |
| Overseas | Rivers | 79 | 59 | 46 | 66 | 63 |
| Sewers | 290 | 276 | 254 | 283 | 285 | |
| Overseas Total | 370 | 335 | 300 | 349 | 348 | |
| Japan+Overseas | Combined Total | 639 | 596 | 580 | 632 | 569 |
BOD、COD
Scope of Data Reviewed: (BOD): 7 manufacturing bases in Japan required to take measurements under the Water Quality Pollution Control Law.
Scope of Data Reviewed: (COD): 1 manufacturing base in Japan required to take measurements under the Water Quality Pollution Control Law.
(Unit: t)
| FY2019 | FY2020 | FY2021 | FY2022 | FY2023 | |
|---|---|---|---|---|---|
| BOD | 0.8 | 0.8 | 1.0 | 0.9 | 1.1 |
| COD | 0.6 | 0.4 | 0.5 | 0.5 | 0.7 |
Scope of Data Reviewed: before Fiscal Year 2020 BOD: 6 domestic sites
PRTR Target Substances
Scope of Data Reviewed: All domestic manufacturing bases in Japan (12 sites)
(Unit: kg)
| Chemical Substance | Volume Handled | Discharge | Transport | Recycling | Consumption | Removal/ Treatment | ||||
|---|---|---|---|---|---|---|---|---|---|---|
| ① Atmospheric Emissions | ② Discharge into Public Waters | ③ Discharge to Soil at Respective Facilities | ④ Landfill Disposal at Respective Facilities | ⑤ Movement of Wastewater to the Sewer System | ⑥ Movement of Waste Outside Respective Facilities | ⑦ Movement of Valuables Outside Respective Facilities | ⑧ Movement as Products, etc. | ⑨ Decomposition, Other responses, etc. | ||
| Ethylbenzene | 526 | 141 | 0 | 0 | 0 | 0 | 385 | 0 | 0 | 0 |
| Xylene | 3,912 | 188 | 0 | 0 | 0 | 0 | 751 | 0 | 0 | 2,973 |
| Cobalt and its compounds | 9,699 | 0 | 0 | 0 | 0 | 0 | 10 | 348 | 9,340 | 0 |
| Inorganic Cyanides (excluding complex salts and cyanates) | 602 | 9 | 0 | 0 | 0 | 0 | 0 | 0 | 0 | 593 |
| Toluene | 1,950 | 1,130 | 0 | 0 | 0 | 0 | 658 | 0 | 162 | 0 |
| Nickel compounds | 1,771 | 0 | 2 | 0 | 0 | 0 | 254 | 16 | 1,499 | 0 |
| Phenol | 1,418 | 213 | 0 | 0 | 0 | 0 | 1,134 | 0 | 0 | 71 |
| Hydrogen fluoride and its water-soluble salts | 11,146 | 3 | 6 | 0 | 0 | 0 | 10,580 | 0 | 0 | 557 |
| Fluorine and its compounds | 109 | 0 | 95 | 0 | 0 | 0 | 3 | 0 | 0 | 11 |
| Manganese and its compounds | 7,083 | 0 | 0 | 0 | 0 | 0 | 1,693 | 0 | 5,390 | 0 |
| Methylnaphthalene | 7,877 | 39 | 0 | 0 | 0 | 0 | 0 | 0 | 0 | 7,838 |
| 1,2-Dimethoxyethane | 239 | 0 | 0 | 0 | 0 | 0 | 0 | 0 | 239 | 0 |
| Trimethylbenzene | 4,382 | 57 | 0 | 0 | 0 | 0 | 822 | 0 | 0 | 3,503 |
| Lead and its compounds | 1,890 | 0 | 0 | 0 | 0 | 0 | 1,511 | 0 | 379 | 0 |
| N-Methyl-2-pyrrolidone | 4,726 | 876 | 0 | 0 | 0 | 0 | 3,850 | 0 | 0 | 0 |
| Grand Total | 57,328 | 2,655 | 103 | 0 | 0 | 0 | 21,651 | 364 | 17,009 | 15,546 |
Comprehensive Overview of Environmental Impact
Items not specified as overseas are domestic data
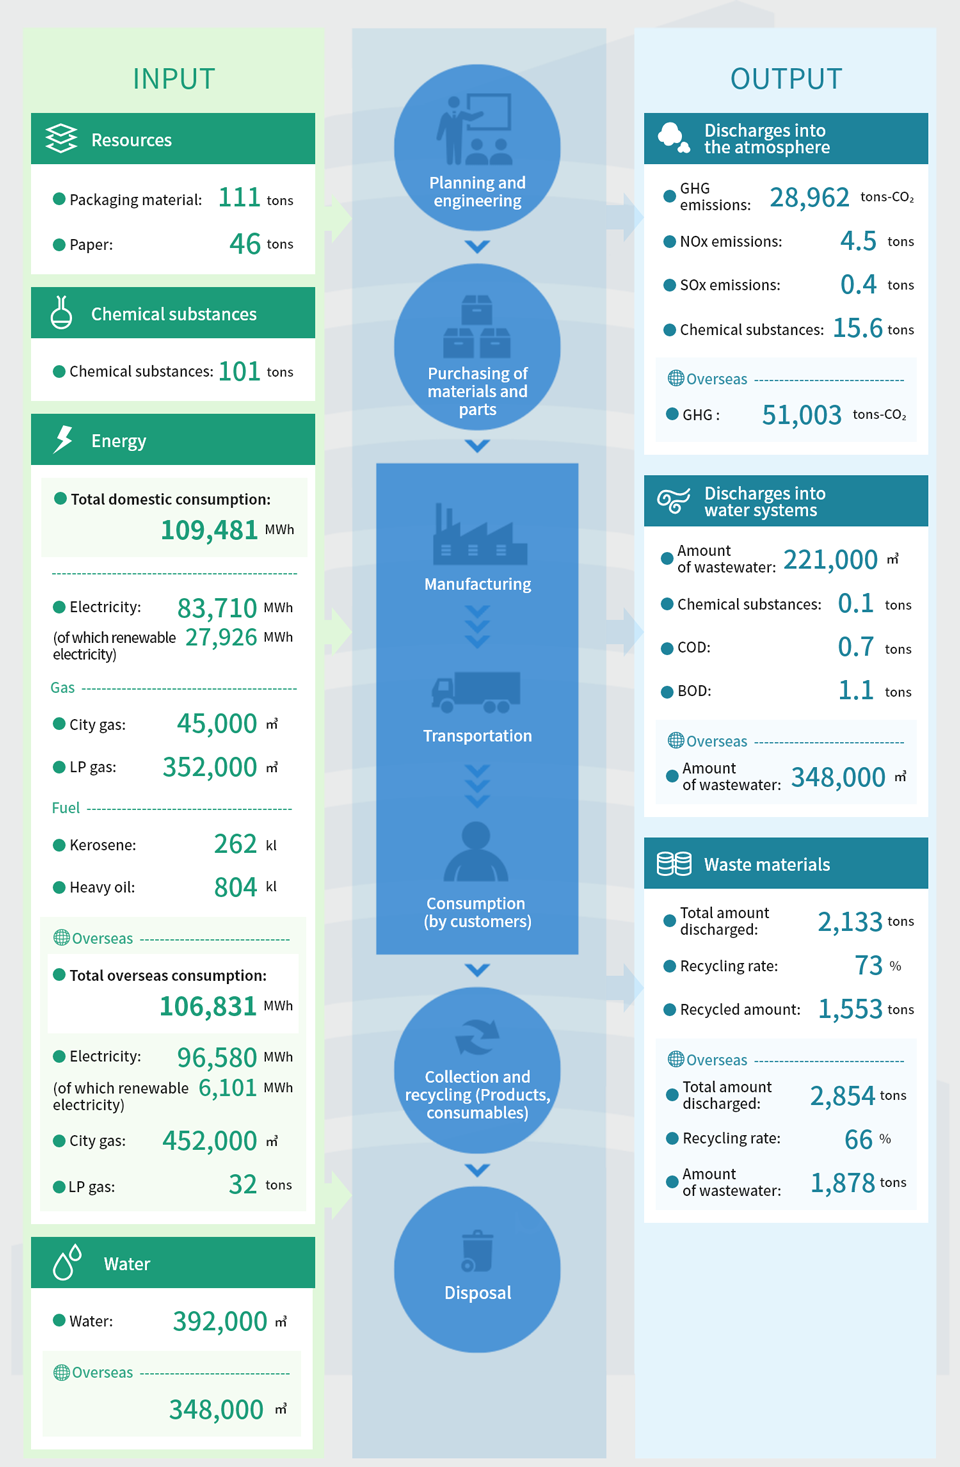
| INPUT | |
|---|---|
| Packaging materials | Paper, plastic, and glass subject to the Container and Packaging Recycling Law |
| Paper | Copy and printer papers used in the company |
| Chemical Substances | PRTR Target Substances, VOC |
| Electricity | Electricity purchased from power companies Renewable energy |
| Gas | City gas, LP gas |
| Fuel | Kerosene, heavy oil, light oil |
| Water | Tap water, industrial water, groundwater |
| OUTPUT | |
|---|---|
| GHG (Greenhouse Gases) | CO₂ and other greenhouse gases (Scope 1 and Scope 2) |
| NOx | Nitrogen oxides generated by the use of gas, oil, etc. |
| SOx | Sulfur oxides generated by the use of oil, etc.
*NOx and SOx are limited to sites with soot and smoke generating facilities regulated by the Air Pollution Control Law. |
| Chemical Substances | Substances subject to PRTR |
| Wastewater | Drainage into rivers and sewage systems |
| COD | Pollution load
*Limited to sites subject to total volume control under the Water Pollution Control Law |
| BOD | Pollution load
*Limited to sites with specified facilities under the Water Pollution Control Law |
| Waste | Waste generated from business activities |
Environmental Accounting
Environmental Conservation Costs
Scope of Data Reviewed: 11 domestic business units in the Seiko Group
(Unit: Million Yen)
| Classification | Contents | Investment※1 FY2023 |
Cost ※2 FY2023 |
|---|---|---|---|
| 1.Operating Costs | 250.5 Total of i, ii, and iii |
1403.9 Total of i, ii, and iii |
|
| ⅰ.Pollution Prevention Costs | Measures related to pollution prevention, such as water quality, air, noise, vibration, etc. | 44.3 | 331.0 |
| ⅱ.Global Environmental Conservation Costs | Actions related to preventing global warming, ozone layer protection, etc. | 203.9 | 619.4 |
| ⅲ.Resource Recycling Costs | Resource conservation, waste reduction and recycling, restrained purchases, etc. | 2.3 | 453.5 |
| 2.Upstream and Downstream Costs | Manufacture of environmentally friendly products | 0.3 | 28.3 |
| Recycling of products, containers, packaging, etc. | |||
| 3.Management Activity Costs | Environmental education, disclosure of environmental information | 65.8 | 150.5 |
| Operation of environmental management systems | |||
| 4.Research and Development Costs | Research and development related to the environment | 0.0 | 11.2 |
| 5.Social Activity Costs | Support for environmental protection organizations and local communities | 0.0 | 1.0 |
| 6.Environmental Damage Response Costs | Costs for soil contamination remediation, etc. | 0.0 | 0.0 |
| Total | 316.6 | 1594.9 | |
※1 Investment amount is for FY2023 only. If the entire amount cannot be classified as environmental conservation costs, a prorated total was used.
※2 Expense amount includes depreciation costs for investments made in previous fiscal years up to the previous year.
Environmental Conservation Effects
| Environmental Impact Factor | Reduction Amount (Effect) |
|---|---|
| GHG | 14,252(t) |
| Water Usage | 20 (thousand m³) |
| Paper Resources | -4(t) |
| Industrial Waste | 116(t) |
| General Waste | 6(t) |
Economic Effects of Environmental Activities
(Unit: Million Yen)
| Details of Actual Effects | |
|---|---|
| Cost Reduction through Energy Conservation | 586.5 |
| Cost Reduction through Resource Conservation (Water) | -1.0 |
| Cost Reduction through Resource Conservation (Paper) | -2.3 |
| Reduction in Waste Disposal Costs | -4.3 |
| Income from Sale of Valuables, etc. (Single-year Effect) | 240.9 |
| Grand Total | 819.8 |
Site-specific Environmental Performance Data
| Name | Description of Main Business Activities | Site Type | INPUT | OUTPUT | ||||||
|---|---|---|---|---|---|---|---|---|---|---|
| Fuel and Heat Consumption (MWh) |
Electricity Consumption (MWh) |
Water Usage (Thousand m³) |
PRTR Chemical Substances (t) |
GHG Emissions ※1(t-CO₂) |
Discharge Volume (Thousand m³) |
PRTR Chemical Substances (t) |
Waste and Emissions Volume (t) |
|||
| SEIKO GROUP CORPORATION Head Office | Consolidated Business Management | Japan/ Office | - | 478 | 7 | - | 0 | 7 | - | 26 |
| SEIKO WATCH CORPORATION Head Office | Watches | Japan/ Office | 1 | 376 | - | - | 4 | - | - | - |
| SEIKO WATCH CORPORATION, Domestic Sales Offices | Watches | Japan/ Office | 18 | 530 | - | - | 208 | - | - | 177 |
| SEIKO TIME LABS CO., LTD. | Watches | Japan/ Office | - | 443 | - | - | 183 | - | - | - |
| SEIKO WATCH CORPORATION, Domestic Sales Subsidiaries | Watches | Japan/ Office | - | 636 | - | - | 237 | - | - | - |
| Seiko Instruments Inc. Head Office | Electronic Devices | Japan/ Office | 2,675 | 1,987 | 16 | - | 1,061 | 16 | - | 151 |
| SEIKO Solutions Inc. | System Solutions | Japan/ Office | 59 | 3,794 | 1 | - | 1,391 | 1 | - | 52 |
| SEIKO Time Creation Inc. | Others | Japan/ Office | 350 | 1,655 | - | - | 726 | - | - | 81 |
| WAKO Co., Ltd. | Others | Japan/ Office | 50 | 3,134 | 6 | - | 388 | 4 | - | 175 |
| Morioka Seiko Instruments Inc. | Watches | Japan / Manufacturing | 1,168 | 18,654 | 34 | 5 | 409 | 22 | 0 | 288 |
| Ninohe Tokei Kogyo Co., Ltd. | Watches | Japan / Manufacturing | 183 | 970 | 2 | - | 53 | 2 | - | 16 |
| Tono Seiki Co., Ltd. | Watches | Japan / Manufacturing | 17 | 1,605 | 2 | - | 5 | 2 | - | 10 |
| Seiko Instruments Inc., Ohno Unit | Electronic Devices | Japan / Manufacturing | 35 | 1,151 | 3 | - | 459 | 1 | - | 62 |
| Seiko Instruments Inc., Takatsuka Unit | Electronic Devices | Japan / Manufacturing | 381 | 13,267 | 77 | 6 | 5,326 | 32 | 1 | 270 |
| Seiko Instruments Inc., Sendai Unit | Electronic Devices | Japan / Manufacturing | 7,714 | 13,143 | 35 | 19 | 7,505 | 15 | 1 | 202 |
| Seiko Instruments Inc., Akita Unit | Electronic Devices | Japan / Manufacturing | 1,612 | 2,243 | 101 | 5 | 1,462 | 18 | 0 | 201 |
| SII Crystal Technology Inc. | Electronic Devices | Japan / Manufacturing | 4,285 | 10,651 | 77 | 16 | 5,169 | 72 | 1 | 227 |
| SEIKO NPC CORPORATION | Electronic Devices | Japan / Manufacturing | 7,223 | 8,759 | 32 | 6 | 5,269 | 29 | 0 | 195 |
| SEIKO WATCH CORPORATION, Overseas Sales Subsidiaries | Watches | Overseas/ Office | 3,132 | 4,885 | 8 | - | 2,804 | 8 | - | 2 |
| Seiko Instruments Inc., Overseas Sales Subsidiaries | Electronic Devices | Overseas/ Office | 728 | 452 | - | - | 334 | - | - | - |
| Seiko Time Creation Overseas Sales Subsidiaries | Others | Overseas/ Office | 52 | 90 | - | - | 69 | - | - | - |
| Guangzhou SII Watch Co., Ltd. | Watches | Overseas / Manufacturing | 100 | 1,553 | 9 | - | 1,072 | 9 | - | 53 |
| Instruments Technology (Johor) Sdn. Bhd. | Watches | Overseas / Manufacturing | 91 | 13,919 | 63 | - | 9,106 | 63 | - | 346 |
| Seiko Manufacturing (Singapore) Pte. Ltd. | Watches | Overseas / Manufacturing | 17 | 14,743 | 91 | - | 5,550 | 91 | - | 207 |
| Dalian Seiko Instruments Inc. | Electronic Devices | Overseas / Manufacturing | 3,556 | 16,798 | 51 | - | 11,470 | 51 | - | 527 |
| Seiko Instruments technology (Shanghai) Inc. | Electronic Devices | Overseas / Manufacturing | - | 706 | 1 | - | 430 | 1 | - | 6 |
| Seiko Instruments (Thailand) Ltd. | Electronic Devices | Overseas / Manufacturing | 2,128 | 33,946 | 90 | - | 16,356 | 90 | - | 1,377 |
| Seiko Precision (Thailand) Co., Ltd. | Electronic Devices | Overseas / Manufacturing | 447 | 9,471 | 35 | - | 3,802 | 35 | - | 337 |
Data is provided for major sites
Some sites may include data from other facilities or affiliated subsidiaries
GHG emissions do not reflect offset amounts already certified
CDP
List of ISO 14001 Certification Acquisitions
All 12 domestic manufacturing sites and 9 overseas manufacturing sites have obtained ISO certification.
Domestic Sites (For detailed information, please click on individual company links)
| Companies with Certification | Applicable Operating Companies | Certification Acquisition Date |
|---|---|---|
| SEIKO NPC CORPORATION | March 1996 | |
| SEIKO GROUP CORPORATION Seiko Instruments Inc. Seiko Future Creation Inc. |
SII Printek Inc. Seiko EG&G Co., Ltd. SII Crystal Technology Inc. |
November 1996 |
| SEIKO Time Creation Inc. (Excluding Clock Business Division) |
December 2004 | |
| SEIKO Solutions Inc. | IIM Corporation CSM SOLUTION CO., LTD. GCC CO., LTD. TOTAL SYSTEM ENGINEERING Co., Ltd. BackStore Co., Ltd. Prestige Co., Ltd. |
January 2014 |
| Morioka Seiko Instruments Inc. | Michinoku Service Co., Ltd. Ninohe Tokei Kogyo Co., Ltd. Tono Seiki Co., Ltd. |
October 2020 |
Overseas Sites
| Companies with Certification | Certification Acquisition Date |
|---|---|
| Dalian Seiko Instruments Inc. | June 2001 |
| Seiko Precision (Thailand) Co.,Ltd. | January 2002 |
| Seiko Instruments (Thailand) Ltd. | March 2002 |
| Instruments Technology (Johor) Sdn. Bhd. | October 2002 |
| Guangzhou SII Watch Co., Ltd. | March 2005 |
| Seiko Instruments Technology (Shanghai) Inc. | July 2012 |
| Seiko Manufacturing ( H.K.) Ltd. | April 2020 ※ |
| Seiko Manufacturing (Singapore) Pte. Ltd. | July 2020 ※ |
※ Due to the Seiko Group's business reorganization in April 2020, prior certifications became invalid, so new certifications were obtained
Social Data
Basic Data
Number of Employees
Scope of Data Reviewed: Consolidated Group (as of March 31, 2024)
(Unit: persons)
| FY2019 | FY2020 | FY2021 | FY2022 | FY2023 | |
|---|---|---|---|---|---|
| Number of Employees | 11,947 (1,732) |
12,092 (1,579) |
11,984 (1,514) |
11,843 (1,332) |
11,740 (1,000) |
※ The number of temporary employees (including part-timers and dispatched workers) is listed separately in parentheses.
Ratio of Regular Employees by Gender
Scope of Data Reviewed: SEIKO GROUP CORPORATION and 19 operating companies in Japan (as of April 1 of the following year)
(Unit: %)
| FY2019 | FY2020 | FY2021 | FY2022 | FY2023 | |
|---|---|---|---|---|---|
| Male | 71.3 | 71.1 | 71.0 | 70.4 | 70.0 |
| Female | 28.7 | 28.9 | 29.0 | 29.6 | 30.0 |
※ The ratio as of April 1 of the following year is used to represent (March 31) fiscal year-end information
Overseas employee ratio
Scope of Data Reviewed: Consolidated Group (as of March 31, 2024)
(Unit:%)
| FY2023 | |
|---|---|
| Overseas employee ratio | 47.7 |
Average Length of Service
Scope of Data Reviewed: SEIKO GROUP CORPORATION and 7 operating companies in Japan
(Unit:years)
| FY2019 | FY2020 | FY2021 | FY2022 | FY2023 | |
|---|---|---|---|---|---|
| Average Length of Service | 17.9 Male 18.9 Female 15.5 |
19.8 Male 20.2 Female 17.4 |
20.0 Male 20.8 Female 17.9 |
19.5 Male 20.3 Female 17.4 |
18.8 Male 19.6 Female 16.7 |
Scope of Data Reviewed: SEIKO GROUP CORPORATION and 7 operating companies in Japan
| FY2019 | FY2020 | FY2021 | FY2022 | FY2023 | ||
|---|---|---|---|---|---|---|
| Average Non-statutory Overtime Hours | 4.9 | 2.9 | 6.9 | 7.4 | 7.1 | |
| Average Age (Years) | Male | 45.4 | 46.0 | 46.4 | 46.5 | 46.2 |
| Female | 41.7 | 42.6 | 42.4 | 42.7 | 42.8 | |
| 3-Year Turnover Rate (Retention Rate) (%) | 5.8(94.2) | 10.6(89.4) | 3.4(96.6) | 9.7(90.3) | 13.0(87.0) | |
Promotion of Diversity
Scope of Data Reviewed: (Ratio of Female Managers): SEIKO GROUP CORPORATION and 19 operating companies in Japan (as of April 1 of the following year)
Scope of Data Reviewed: (Employment Ratio of Persons with Disabilities): SEIKO GROUP CORPORATION and 8 companies certified as Group companies including special subsidiaries
(Unit: %)
| FY2019 | FY2020 | FY2021 | FY2022 | FY2023 | |
|---|---|---|---|---|---|
| Percentage of Female Managers ※1 | 13.4 | 13.7 | 13.2 | 13.3 | 14.2 |
| Employment Ratio of Persons with Disabilities ※2 | 2.3 | 2.7 | 2.3 | 2.4 | 2.4 |
※1 The ratio of female managers as of April 1 of the following year is used to represent year-end information
※2 The employment ratio of persons with disabilities as of June 1 of the following year is used to represent year-end information
Promotion of Work-Life Balance
Parental Leave Taken
Scope of Data Reviewed: SEIKO GROUP CORPORATION and 7 operating companies in Japan
| FY2021 | FY2022 | FY2023 | ||||
|---|---|---|---|---|---|---|
| Male | Female | Male | Female | Male | Female | |
| Number of Eligible Individuals ※1 (Regular Employees) | 39 | 44 | 30 | 19 | 33 | 21 |
| Number of People Taking Parental Leave | 9 | 44 | 14 | 19 | 29 | 21 |
| Parental Leave Utilization Ratio ※2 (%) | 23.0 | 100.0 | 46.7 | 100.0 | 87.9 | 100.0 |
※1 Eligible Individuals = Employees eligible for parental leave starting in the respective year.
※2 Parental Leave Utilization Ratio = Percentage of eligible individuals who started parental leave within the respective year.
Human Resource Development
Hours allocated to skill development training
Scope of Data Reviewed: SEIKO GROUP CORPORATION
(Unit: hours)
| FY2023 | |
|---|---|
| Average training hours per person | 19.8 |
| Total training hours (all staff) | 3,347 |
Occupational Health and Safety
Occupational accidents
Scope of Data Reviewed: SEIKO GROUP CORPORATION and 8 operating companies in Japan
| FY2021 | FY2022 | FY2023 | |
|---|---|---|---|
| Number of fatal accidents (cases) | 0 | 0 | 0 |
| Number of accidents resulting in leave (cases) | 0 | 0 | 0 |
| Frequency rate of accidents resulting in leave1 *1 | 0.00 | 0.00 | 0.00 |
| Lost time due to accidents2 *2 | 0.00 | 0.00 | 0.00 |
*1 Number of employees on leave per million working hours of enrolled workers
*2 Total number of lost workdays per thousand working hours of enrolled workers
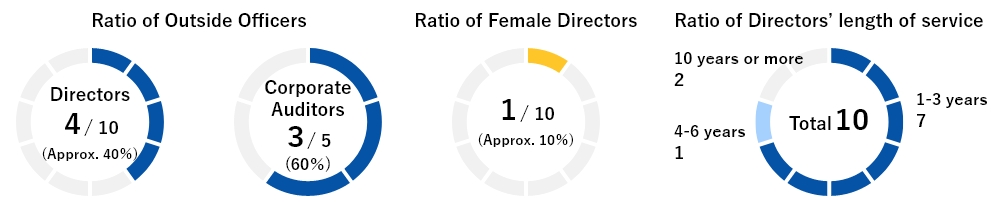
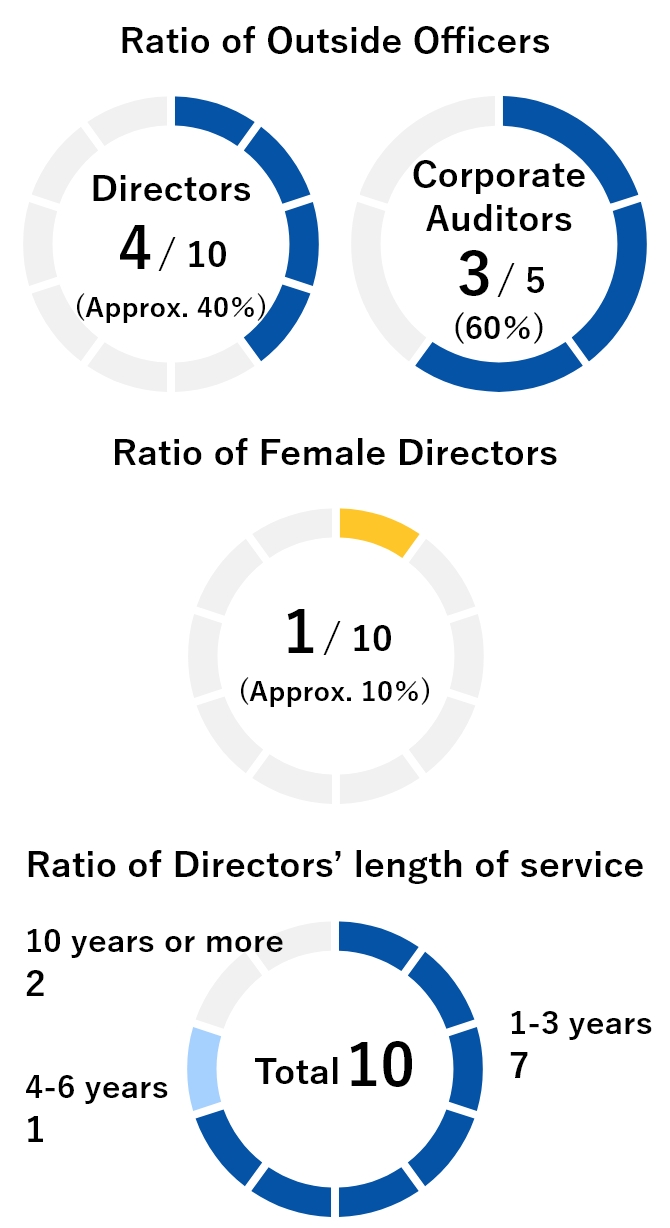
Governance Data
Board of Directors Composition Ratios
(As of June 27, 2024)